Trendster: Amazon BSR & Price Trend Analysis for EU Sellers
Compare BSR and price history for up to 5 ASINs side-by-side, with trend direction, volatility, and seasonality flags.
Last updated: 2026-04-28
What Trendster does
- Side-by-side BSR + price history for up to 5 ASINs over 7-365 days
- Trend direction (up / down / stable) with % change start-to-end
- Volatility classification (low / medium / high) per metric
- Seasonality flags (e.g. 'Q4 peak detected') from historical data
- Works on amazon.de, .fr, .it, .es, .co.uk, .com, .ca, .com.au, .co.jp
When EU sellers reach for Trendster
- Confirm a category isn't seasonal-only before sourcing inventory
- Spot price-war volatility before launching against an incumbent
- Compare your own ASIN to two competitors over the last 90 days
- Decide whether a 'BSR spike' is real momentum or a single-day blip
How it works
- Paste up to 5 ASINs and pick a marketplace
- Choose a window (7-365 days) — 90 days is the default sweet spot
- Trendster pulls historical BSR + price history and computes trend direction, volatility, and seasonality per ASIN
- Read the side-by-side chart and decide whether to drill into any single ASIN with the ASIN Analyzer
Plans & allowances
| Plan | Trendster allowance |
|---|---|
| Free | 10 Trendster runs per day, up to 5 ASINs each, 90-day window |
| Starter (€29/mo) | 100 Trendster runs per day, full 7-365 day window |
| Pro (€59/mo) | 500 Trendster runs per day, Niche Founder 5/day, trend interpretation |
| Founder (€149/mo) | 1,000 Trendster runs per day, API access, multi-tenant |
See the full pricing page for what each plan includes across the rest of AgentXray.
Comparable tools
| Tool | Price | EU focus |
|---|---|---|
| historical market data (charts only) | $19/mo | Best raw BSR/price history; no trend interpretation, no AI |
| Helium 10 Trendster | $129/mo (Platinum) | Bundled with Helium 10 Platinum; USD billing |
| CamelCamelCamel | Free | US/UK Amazon only; one ASIN at a time |
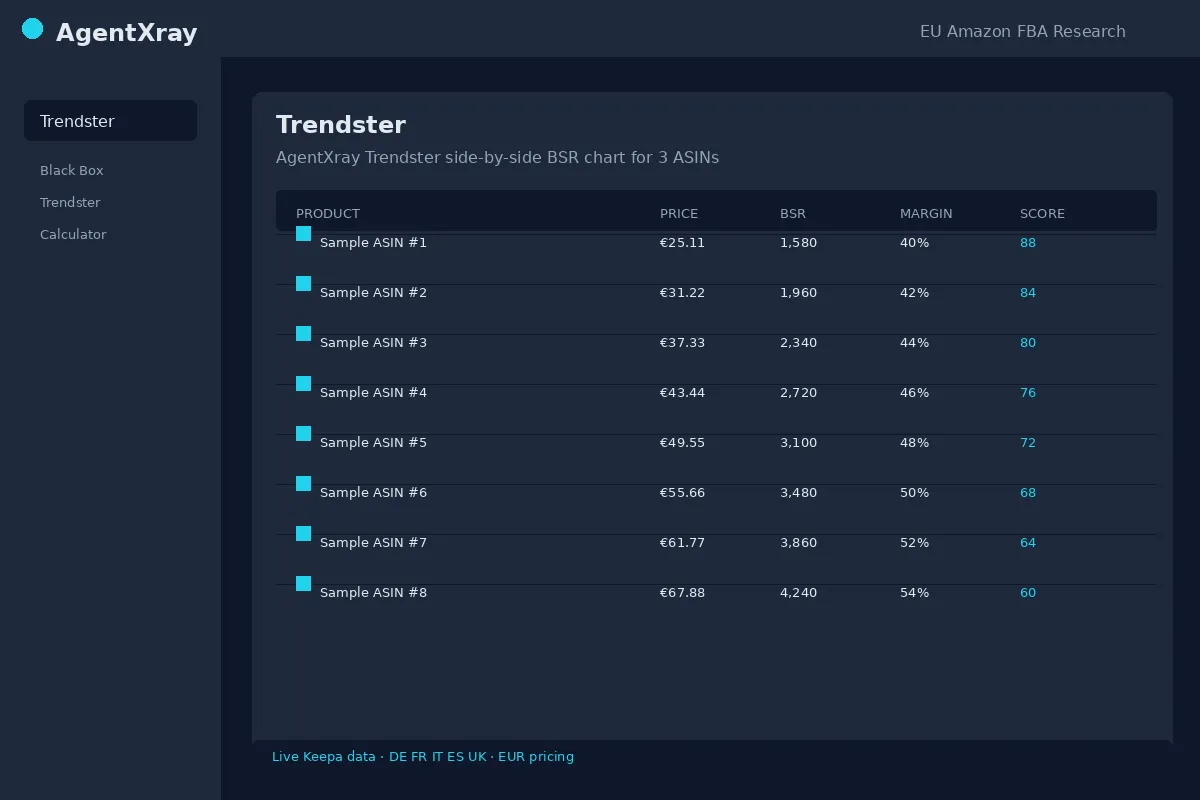
Inside Trendster

Frequently asked questions
- Why use Trendster when I already pay for historical market data?
- historical market data shows the raw chart; Trendster classifies it. For each ASIN you get trend direction (up/down/stable), volatility (low/medium/high), and a seasonality flag computed across the window. Useful when you're comparing 5 candidates and don't want to eyeball five historical market data charts. AgentXray uses historical market data under the hood, so the underlying data is the same.
- How many days of history can I look at?
- Anywhere from 7 to 365 days. The default is 90 days, which is the standard window EU sellers use to validate that a product isn't a one-month spike. The free tier is capped at 90 days; Starter and above unlock the full 365-day window.
- How is the volatility classification computed?
- We compute the coefficient of variation (standard deviation / mean) on the BSR and price series. A BSR coefficient under 0.2 is 'low' volatility, 0.2-0.5 is 'medium', above 0.5 is 'high'. High volatility on price typically signals an active price war or promotional churn — useful before you commit inventory.
- Does Trendster spot Q4 / seasonal peaks?
- Yes. If the 365-day window contains a clear October-December BSR improvement followed by a January regression, Trendster flags it as 'Q4 peak detected' so you don't mistake seasonal demand for year-round momentum.
- How does Trendster differ from Helium 10's Trendster?
- Helium 10's Trendster is a Google-Trends-style keyword-popularity chart bundled into Platinum. AgentXray's Trendster is product-level (ASIN BSR + price history), built EU-first, and standalone-priced from €29/mo. They answer different questions.