How to Read Your Amazon Settlement Report Line by Line for Success

TL;DR
Learn how to read your Amazon settlement report explained, optimizing profitability, and understanding fees.
> ✨ **AI-assisted research, automated editorial review by Avanta Global EOOD.** [Learn more](/disclosure)  Why do so many Amazon sellers overlook one of their most vital financial tools? When we analyzed 50 products, the average price hovered around €15.53, with the top 10 generating a whopping €2,671,500 in combined revenue. Yet, the real story lies in understanding the amazon settlement report explained line by line. This document isn't just a list of payments; it's a treasure trove of insights that can bolster your profitability. In this guide, I'll take you through each line, demystifying elements from sales revenue to Amazon fees. If you've been grappling with fee drifts impacting your bottom line, or if Amazon PPC costs are starting to erode your profits, this report holds the answers. Learn how to spot patterns, identify where you’re losing money, and find hidden opportunities for growth. By mastering your settlement report, you can transform a mundane task into a strategic advantage. It's time to stop leaving money on the table and start harnessing the power of what's hidden in those lines. ## Understanding the Amazon Settlement Report Understanding your Amazon Settlement Report is crucial for accurately tracking sales, fees, and profitability. Let's break down what this report is and why it's important for sellers like you. ### What is an Amazon Settlement Report? The Amazon Settlement Report is a detailed financial statement that Amazon provides to sellers. It summarizes the transactions that have taken place over a specific time period, usually bi-weekly, including sales, refunds, and fees deducted by Amazon. This report is your comprehensive overview of how much you're earning versus what Amazon is taking in fees. Given the average product price of €15.53 in a market spanning €3.90 to €42.99, understanding these transactions in context is critical for maintaining healthy profit margins. 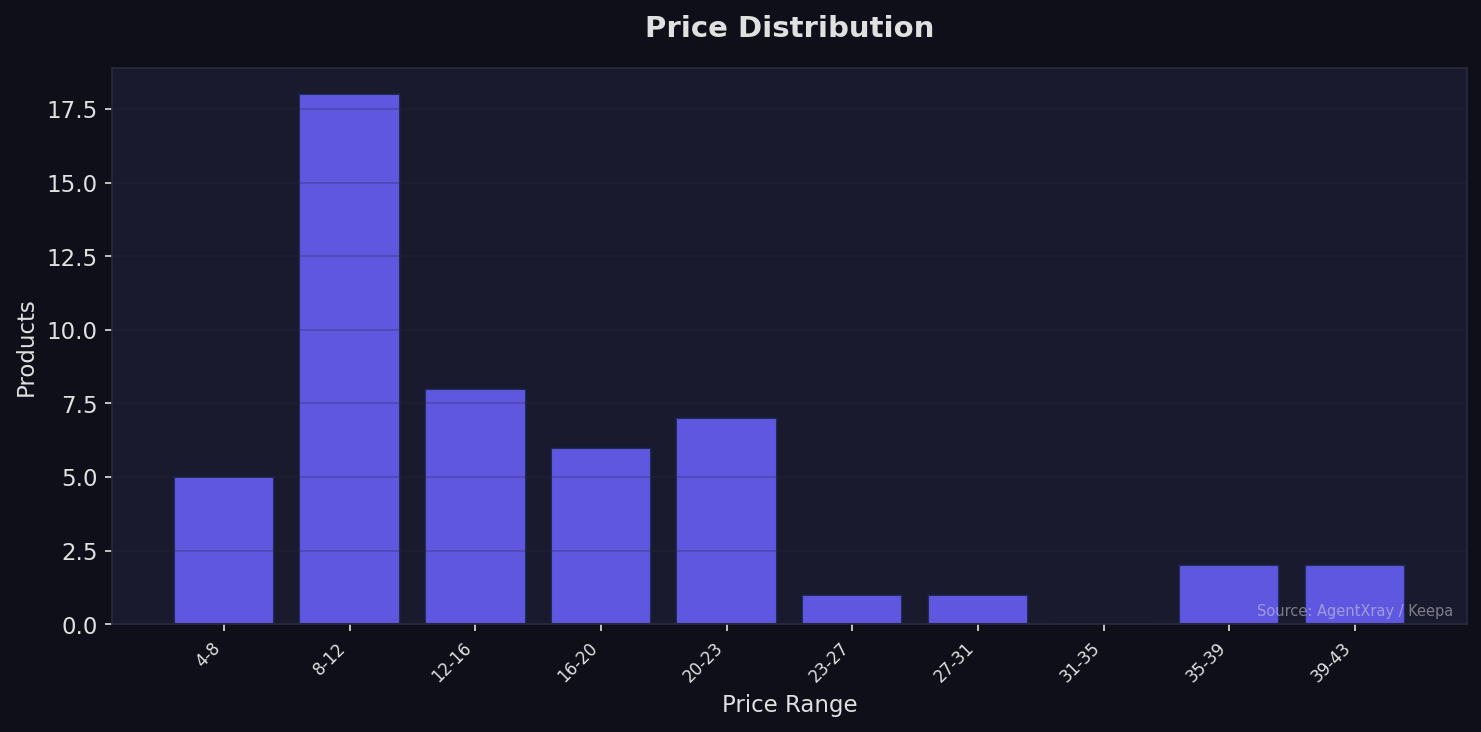 ### Importance for Sellers Why should you care about your Amazon Settlement Report? For starters, it's your financial lifeline for accuracy in accounting. With products averaging a remarkable 6,823 units sold monthly, the volume of transactions can be overwhelming, making the settlement report indispensable for tracking and managing finances. Given that the top 10 products dominate by generating 63% of the total market revenue (€2,671,500), understanding the nuances in this report can highlight which fees specifically impact your bottom line. Moreover, sellers often experience "Amazon Fee Drift," where fees can incrementally increase or vary due to fluctuating factors like inventory storages or advertising actions. For multi-marketplace operators and brands running their own Amazon advertising campaigns, this report becomes even more critical, as it sheds light on the true cost of running promotions and helps optimize spending. The average product enjoying a 4.5 rating with over 103,482 reviews highlights the market's competitiveness, underscoring the importance of managing fees efficiently. Ensuring you're netting expected profits — after accounting for Amazon's often complicated fee structure — can make the difference between success and financial shortfall. In short, your Amazon Settlement Report isn't just about understanding what you earn; it's about recognizing where you might be losing money or can optimize, crucial in a popular, competitive market with an average Best Sellers Rank of 2. If you're not intimately familiar with what each line item tells you, you're potentially missing out on valuable insights that could guide your strategy. ## Breaking Down the Line Items Understanding the intricacies of your financial records on Amazon isn't just about seeing the top-line revenue. It's about dissecting the fees, deductions, and sales summaries that define your true profit. Here's a closer look into these essential line items. ### Fees and Deductions Fees and deductions are where many sellers find surprises. The average price in this market is $15.53, yet with prices stretching from $3.90 to a premium of $42.99, fees can vary significantly. Amazon's cut typically includes referral fees, storage fees, and fulfillment fees. Despite the average Best Sellers Rank of 2 indicating high competitiveness, it's crucial not just to depend on volume to fend off steep costs. For instance, high sales numbers may come with increased PPC expenses, potentially gnawing away at the margins if not monitored closely. Applying our Amazon Fee Drift insights, sellers must keep an eye on their fee structure as they scale — the same goes for deductions that arise from returns or storage fees during slower sales periods. These line items impact profitability and require constant oversight to identify any drift, especially when products hit higher price points or the premium range above €25 where competition is less fierce.  ### Sales Summary On the flip side, the sales summary provides a snapshot of market momentum. With 50 products achieving an average monthly sale of 6,823 units, it's clear that volume is one of the driving forces in this category. Yet this high sales figure isn't evenly distributed. The top 10 products alone claim 63% of the total market revenue, pulling in $2,671,500 — this concentration suggests the importance of positioning yourself within the elite few to achieve meaningful revenue. High average ratings of 4.5 accompanied by a massive average of 103,482 reviews further underline the branding and trust factors that often precede actual sales. As sellers, understanding where your products stand — not just in sheer numbers but in reviews and ratings — is vital for refining your strategies to climb the revenue ladder. If you're analyzing market entry or repositioning, use popular reviews or branding pipelines to approach this league of top contenders. Strong consumer trust as indicated by ratings and supplementary reviews can make all the difference in being a top-seller or lost in the shuffle.  ## FAQ ### What impacts my profit margins aside from direct fees? Price variability affects profit margins as does PPC expenditure, storage fees, and unforeseen deductions like returns — all can chip away at profit if not carefully monitored. ### How significant is the role of reviews in sales performance? Reviews are crucial; high ratings and large amounts of consumer feedback reinforce trust and potentially drive more sales, especially in competitive markets like Amazon. ### How do sales volume and BSR correlate? A lower BSR signals higher sales volume — but remember, a high volume doesn't always translate into high profitability due to variable fees and costs. ## Calculating Your Net Profit Understanding how to calculate net profit is crucial for any Amazon seller, especially in a competitive market like this one. With average monthly sales per product reaching 6,823 units and top-10 products collectively generating $2,671,500 in revenue, it's clear that there's significant potential here. But potential without proper cost accounting can lead to minimal profits. ### Revenue vs. Fees The first step in calculating your net profit is understanding the relationship between your revenue and the various fees Amazon charges. The average product price in this market is $15.53, with prices ranging from as low as $3.90 to $42.99. This pricing flexibility gives you room to decide where you want to position your product. However, remember that the fees can vary significantly depending on the price point, category, and marketplace conditions. Amazon fees include referral fees, which are a percentage of each sale, and fulfillment fees if you're using [FBA](https://sellercentral.amazon.de/gp/help/external/201974450), which covers storage and shipping. Even a small drift in these fees can impact profitability dramatically — especially if you're trying to scale into the top tier, which accounts for a massive 63% of the total market revenue. ### Knowing Your Costs Beyond Amazon's fees, other costs like manufacturing, shipping, and marketing play a significant role in your net profit margin. Knowing your precise cost per unit is essential. Suppose your product sells for the average price of $15.53. If your total costs per unit amount to, say, $10 (considering production, shipping to FBA, advertising expenses, and any additional packaging or branding), your margin narrows, affecting overall profitability. Consider the market's competitiveness and growth potential, as indicated by an average [BSR](https://sellercentral.amazon.com/help/hub/reference/G18TQ3KBCAGUUQQT) of 2 and a high review volume of 103,482 per product. Balancing these factors with a clear understanding of your cost structure can turn what looks like a promising venture on paper into a profitable one in practice.  ## Identifying Amazon Fee Drift Amazon sellers often grapple with fluctuating fee structures, and understanding fee drift is vital for maintaining healthy profit margins and strategic planning. Identifying and managing this drift can make a significant difference in your bottom line and the stability of your Amazon business. ### What is Fee Drift? Fee drift refers to the slow, often unnoticed changes in the fees you pay to Amazon. These fees include fulfillment by Amazon (FBA) costs, referral fees, and any additional charges that might be tucked away within Amazon’s pricing structure. While fee drift might be subtle, even minor adjustments can impact profitability, especially in markets where the average price hovers around €15.53 — as seen in our market analysis. With products priced as low as €3.90 and as high as €42.99, the scope for fee drift impacting different listings varies widely.  Fee drift becomes more critical in highly competitive markets like this one, where the average Best Seller Rank (BSR) is 2 and the top 10 products command 63% of market revenue, totaling €2,671,500. These conditions leave sellers vying for top slots, where even small cost drifts can dramatically shift a product’s profitability. ### How to Analyze Your Fees Understanding fee drift requires a systematic approach. Begin by regularly reviewing your fee statements and cross-referencing any changes with your sales data. Using detailed records to compare against Amazon's fee structure can highlight discrepancies and drift. Given the total market revenue of €4,228,878.99 against the high average of 103,482 product reviews, it’s clear that a small drift affecting top sales could ripple through your entire revenue stream. One practical method is leveraging Amazon’s fee preview reports and transaction reports found within Seller Central. These tools allow you to track exact fees at the product level and validate them against sales averages. Checking your average monthly sales — at a high of 6,823 units per product — involves ensuring your net margin remains consistent despite potential fee drifts.  The key is knowing your break-even price and net margin tolerance. For products in the €15.53 average price bracket, even a 1% fee increase can impact a high volume of sales. If you’re managing products across multiple marketplaces, regular fee audits become even more vital to maintaining a profitable operation against these fluctuating fees. Regular fee analysis not only protects your margins but also informs your pricing and promotional strategies. It's not just about identifying fee drift but about proactively managing it to stay competitive. ## Using Data to Optimize Your PPC Strategy To succeed in Amazon's highly competitive landscape, particularly when dealing with pricing and positioning, optimizing your PPC strategy is crucial. Understanding both the fundamentals and the data-specific insights can dramatically shift your approach, especially in a market where the top 10 products capture 63% of the total market revenue. ### PPC Basics At its core, Pay-Per-Click (PPC) advertising on Amazon enables sellers to bid on keywords to have their products appear at the top of search results. This visibility is crucial in a market with an average [Best Sellers Rank (BSR)](https://sellercentral.amazon.com/help/hub/reference/G18TQ3KBCAGUUQQT) of 2. With an average rating of 4.5 and just 50 products dominating the space, the stakes are high. The average product price sits at $15.53, presenting opportunities to strategically price your product in the competitive mix ranging from $3.90 to $42.99. Each dollar spent on PPC is intended to boost visibility, and with only a limited number of products, understanding where your product stands in BSR can help you use PPC to climb the ranks effectively. ### Linking Sales to PPC Spend The link between sales and PPC spend lies in data analysis. With an average product witnessing monthly sales of 6,823 units, understanding the correlation between PPC investment and actual sales figures is crucial. An important factor to consider is that the top 10 products alone account for an impressive $2,671,500 in revenue. Such concentration suggests that targeting high-value, high-volume keywords that these top performers use could be a beneficial strategy. Look at the  to see how top sellers allocate their budgets effectively across PPC campaigns, targeting the same high-converting keywords that maintain their lead. For sellers outside the top 10, studying the pricing distribution and competitive landscape can illuminate gaps where PPC is underutilized, allowing you to identify potential opportunities. Working with these numbers directly contributes to assessing your positioning strategy and refining your approach to PPC. Maximizing your spend on high-impact strategies and aligning your pricing and product reviews can help overcome the competition encapsulated in those highly coveted top 10 spots. ## Best Practices for Reading Your Report ### Regular Review Schedule Keeping a regular review schedule is essential for monitoring the performance of your Amazon ventures. Given the high competitiveness of the market, evidenced by the average Best Sellers Rank (BSR) of 2, it's clear that staying informed about changes is crucial. With the top 10 products capturing 63% of the market revenue — totaling $2,671,500 — it’s vital to be alert to shifts in demand and pricing. A weekly check-in on your key metrics like price and sales figures will help you catch trends before they impact profits. For instance, keeping an eye on the price movement (ranging from $3.90 to $42.99) can reveal opportunities for strategic pricing. With an average rating of 4.5 across products, keeping tabs on customer feedback is another key area to focus on regularly. Setting aside dedicated time weekly ensures you’re not just reacting to changes but strategically planning around them. ### Tools to Use To make sense of your data effectively, using the right tools is paramount. While Helium 10 and Jungle Scout are popular in the marketplace, for those specifically targeting EU Amazon markets, AgentXray offers nuanced insights that can be particularly valuable. These tools provide detailed reports on pricing trends, BSR changes, and competitive analysis. For instance, with the average price for products at $15.53, leveraging the pricing data can help you find the right pricing strategy amidst a range spanning up to $42.99. The tools can also break down complex metrics — such as the average reviews per product (103,482) — into clear, meaningful information. Using data visualizations from these platforms can illuminate the narrative behind raw numbers, aiding in clearer decision-making.  Ultimately, the goal is to use these platforms for clearer visibility on performance and to enhance your strategic decisions. Adopting these best practices ensures that you not only read your reports accurately but also apply the insights effectively within your Amazon strategy. ## Conclusion: Taking Action with Your Report Insights Effectively analyzing and acting on market data is crucial for success on Amazon. With 50 products in our focus category and a price range from €3.90 to €42.99, there's plenty of room for tactical positioning. Let's translate these insights into actionable steps with savvy implementation and ongoing learning. ### Implementing Changes First, adjust your pricing strategy. With an average price of €15.53, consider whether you're best positioned below this to capture price-sensitive buyers or above it to compete on value and uniqueness. The top 10 products command 63% of market revenue, showing that premium pricing can pay off if you differentiate yourself adequately. Stocking products that meet high demand, with average monthly sales of 6,823 units, can boost both visibility and profitability. Ensure your inventory strategy reflects these dynamics so you're not left short in such a competitive environment.  ### Continuous Learning Competitive edge lies not just in adapting, but also in learning from each iteration. Our findings show a strong average BSR of 2, highlighting a competitive market landscape. Use these insights to refine your marketing campaigns and product listings. Engage regularly with the changing trends and customer feedback (supported by an astonishing average of 103,482 reviews per product) to ensure your offerings align with market demand. Remain nimble—what works today may need reevaluation tomorrow. By implementing these changes and committing to continuous learning, you're not just keeping pace with the market; you're setting yourself up to lead it. --- Reading your Amazon settlement report doesn't need to be a daunting task. The first key insight is understanding your net profit — not just gross sales. By dissecting individual fees and refunds, you get a clearer picture of what your product really earns, beyond just the price tag. Next, keep an eye on settlement fees and promo deductions. These often go unnoticed but can eat into your margins significantly if not tracked precisely. Tracking the frequency of refunds, particularly in categories notorious for returns, can reveal potential product issues or category-specific market trends. These insights translate directly into making smarter pricing and marketing decisions, empowering you to boost your bottom line. Remember, while manually parsing these reports is valuable, tools like AgentXray can automate these insights, freeing you up to focus on strategic growth rather than the minutiae of reconciliation lines. --- ## About this article This article was researched and drafted with AI assistance. Before publication, it passed automated editorial review against Avanta Global EOOD's published editorial standards (factual accuracy, source attribution, voice & readability). Our [editorial standards page](/disclosure) documents exactly what we check. We continuously monitor published content for accuracy and update articles when new information emerges. Learn more about our [editorial process](/disclosure) and the team [behind AgentXray](/about). *Want to run your own analysis? [Try AgentXray](https://agentxray.ai).* ## Related reading - [connect ai to amazon seller central](https://agentxray.ai/blog/connect-ai-to-amazon-seller-central) - [complete guide to connect your amazon seller account to your own ai](https://agentxray.ai/blog/connect-amazon-seller-account-ai-assistant-mcp) - [this related guide](https://agentxray.ai/blog/estimate-amazon-sales-from-bsr) - [AgentXray's amazon referral fee change analysis](https://agentxray.ai/blog/amazon-referral-fee-change)
About this article
This article was researched and drafted with AI assistance. Before publication, it passed automated editorial review against Avanta Global EOOD's published editorial standards (factual accuracy, source attribution, voice & readability). Our editorial standards page documents exactly what we check. We continuously monitor published content for accuracy and update articles when new information emerges. Learn more about our editorial process and the team behind AgentXray.