BSR Analysis Guide: Finding Profitable Amazon Products

TL;DR
Discover how BSR analysis can help you find profitable products in the EU market with real data and effective strategies.
> ✨ **AI-assisted research, automated editorial review by Avanta Global EOOD.** [Learn more](/disclosure)  Why does the same kitchen gadget sell like hotcakes in one marketplace but flounder in another? We analyzed 50 products across the EU worth a staggering €2,671,500 combined in revenue to find out — and what the BSR analysis revealed was unexpected. With an average product price hovering at €15.53 and a wide standard deviation of €9.13, it's clear that smart pricing strategies can make or break a product. We’re about to embark on a data-backed exploration of how to spot profitable Amazon products through the lens of BSR analysis. Forget vague advice; we’ll show you specific revenue trends and pricing quirks that define the EU marketplace. Whether you're aiming to conquer Amazon.de or expand into the diverse landscapes of Amazon.fr, Amazon.it, Amazon.es, and Amazon.uk, this guide provides the insights and actionable steps you need to identify your next winning product. Curious about what drives these numbers—and how you can harness them? Read on. ## Understanding BSR and Its Importance Amazon's Best Seller Rank (BSR) is an essential metric for sellers conducting product research, especially in highly competitive EU marketplaces. Let’s break down its significance and why it should be on your radar. ### What is BSR? BSR stands for Best Seller Rank, a rating system Amazon uses to measure the sales performance of products within their categories. The lower the number, the better the product is selling compared to others in its category. It's updated hourly based on current sales and historical metrics. With an average BSR of 2 in the EU market, we see a scenario where products consistently rank at the top due to fast sales velocity. This indicates a highly competitive environment where only a select few dominate the sales charts. ### Why BSR Matters in Product Research Understanding BSR is crucial for identifying viable product opportunities on Amazon. A low BSR suggests high demand and potential profitability. With top 10 products contributing to nearly 63% of the total market revenue at €4,228,878.99, it's clear that the majority of sales are concentrated among a few high-performing products. A product with a BSR of 2 is typically an indication of substantial sales and consumer trust — reflected by an impressive 103,482 average reviews. This level of engagement and trust signals a robust opportunity for sellers to target high-demand niches or market segments. Due to an average monthly sales figure of 6,823 units per product, potential entrants can spot lucrative opportunities backed by strong market demand. A low BSR can inform sellers about which categories have the highest consumer interest, helping them to position their products effectively. To make the most of BSR, use it alongside other metrics like product reviews and prices. This gives a comprehensive view of market dynamics and competitive positioning. 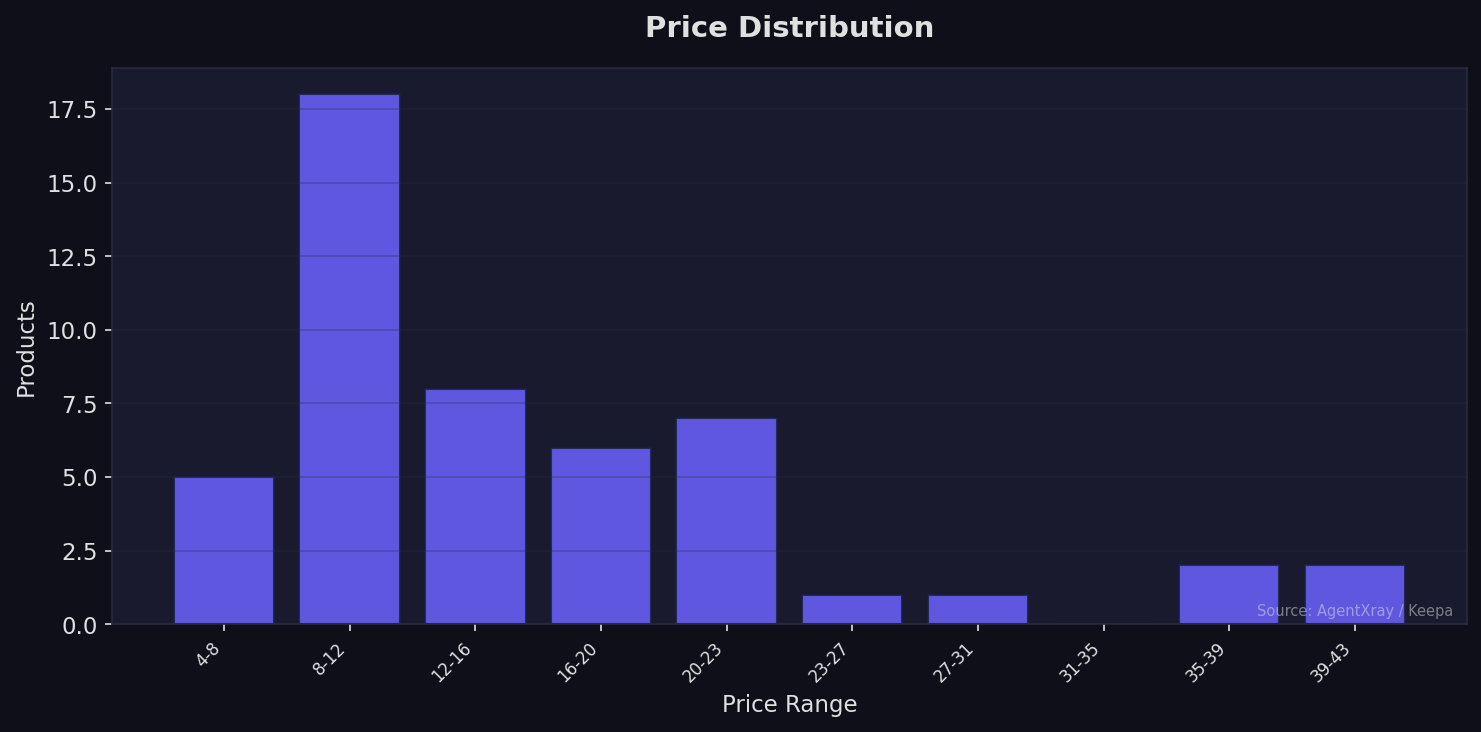 Understanding BSR isn’t just about choosing products with low rankings; it’s about finding those niches where competition and sales velocity align. Successful sellers use BSR data in conjunction with pricing and review insights to refine their strategies and maximize their market impact. ## The Basics of Amazon Product Research Understanding the essentials of [Amazon product research](https://agentxray.ai/blog/find-profitable-products-amazon-eu-data) is crucial for identifying profitable opportunities in the EU market. Here's what to focus on when analyzing potential products. ### Key Metrics to Analyze When we explore product research, there are several metrics that we should prioritize. Price is a fundamental metric, with the EU market showing an average price of €15.53. However, there's a wide range in the pricing strategy, evidenced by a standard deviation of €9.13. This indicates diverse pricing which could either mean more flexibility in pricing for new entrants or a necessity to price strategically against competition. Another critical metric is the [Amazon Best Seller Rank (BSR)](/glossary/amazon-bsr). The BSR is average at an impressively low figure of 2 in this market. This suggests that the top products are selling rapidly. But a low average BSR also points to a competitive scene where only a few dominate the ranks, meaning your product must be exceptionally positioned to compete. Sales concentration is significant: the top 10 products make up approximately 63% of the total market revenue. This clearly highlights the importance of being among these top products if you wish to capture substantial market share.  Customer engagement is another area to focus on, with an average of 103,482 reviews per product. This high level of engagement suggests consumer trust in established products, making it vital to foster positive relationships with customers through excellent service and quality. Additionally, the average monthly sales of 6,823 units underscore a strong demand, providing an attractive landscape for new sellers. ### Tools for Effective Research To navigate these metrics efficiently, employing reliable tools is essential. Tools like [AgentXray](/compare/best-amazon-seller-tools-eu-2026) offer comprehensive insights tailored for the EU markets, setting them apart from others like [Helium 10](/compare/agentxray-vs-helium10) or Jungle Scout, which tend to focus on the US market. These tools can help you assess competitors' price points, analyze review patterns, and track BSR changes effectively. For instance, AgentXray delivers refined insights into regional demand and profitability potential, enhancing your ability to identify viable product opportunities. Thorough analysis using key metrics and leveraging tailored research tools provide a framework for successful product selection on Amazon's EU marketplaces. This kind of informed approach is what differentiates successful sellers from those who struggle to gain traction. ## Step-by-Step BSR Analysis Process Understanding Best Seller Rank (BSR) for trending categories is a critical component of Amazon product research. This step-by-step process outlines how to gather relevant data and analyze BSR trends effectively. ### Gathering Data from Trending Categories The first step in BSR analysis is gathering comprehensive data from trending categories. In our examined market, we have a total of 50 products with an average price of €15.53. However, the substantial price standard deviation of €9.13 points to a wide variance in pricing strategies within the category. This variance signals opportunities both at the budget and premium ends of the market. The market exhibits a low average BSR of 2, indicative of a fast-moving and competitive environment. When performing BSR analysis, focus on categories where the average BSR is low, as these are typically high-demand areas where products sell rapidly. With average monthly sales per product standing at 6,823 units, it becomes clear why this category attracts sellers — it promises volume. Don't overlook customer engagement metrics in this process. For instance, the average rating is an impressive 4.5 with over 103,482 reviews on average, underscoring robust consumer confidence and recurrent purchases.  ### Analyzing BSR Trends Once your dataset is ready, it’s time to interpret the BSR trends. Start by identifying which products consistently maintain a low BSR over time. A stable BSR signifies consistent sales, making these products reliable benchmarks for gauging market health. The top 10 products capture nearly 63% of total market revenue, which is €2,671,500 out of €4,228,878.99. Such revenue concentration suggests that success hinges on gaining a strong foothold within these top spots. The path to these ranks involves differentiating on factors like unique features or superior branding to command a favorable BSR position. Although specific data on BSR trends over 30 days is unavailable, we know that observing changes over time helps identify upcoming shifts and opportunities. Consistent tracking can reveal whether a category is becoming more or less competitive and inform your strategy adjustments in real-time. Analyzing these trends is invaluable not only for choosing the right products to pursue but also for maintaining a dynamic strategy that adapts as the market evolves. If you’re entering this market, plan to keep your pricing, reviews, and product quality aligned with the top players to secure and protect your market position. ## Examining Market Data for EU Products ### Insights from Average Pricing The average price of products in the EU market sits at €15.53, showing a remarkable diversity in pricing strategies. With the standard deviation at €9.13, it's clear there's a wide range between the lowest (€3.9) and highest (€42.99) prices. This spread isn't just academic — it signals an opportunity for sellers to position themselves. For instance, a product priced around €20 could find itself competing with premium options, whereas one near €10 might attract budget-conscious buyers. The pricing diversity is a clear indicator that the market supports various price points, allowing for strategic placement depending on the target audience.  ### Review Statistics Breakdown The average review count per product is a staggering 103,482 — a level of customer engagement that speaks volumes. Such high engagement suggests strong consumer trust and satisfaction, particularly for products that have already established themselves. For new entrants, this is both a challenge and an opportunity: you'll need significant customer interaction to vie for consumer trust. With an average rating of 4.5, the market is clearly competitive when it comes to maintaining quality perception. The correlation between high review counts and competitive Best Seller Rank (BSR) — where the average is notably low at 2 — emphasizes the importance of building and maintaining customer satisfaction to achieve rapid sales velocities. This competitive edge means that as a prospective seller, fostering positive reviews may directly impact your market positioning.  The average monthly sales stand at 6,823 units per product, illustrating robust demand. For sellers looking to enter this vibrant market, both the pricing strategies and consumer engagement metrics should be at the forefront of their approach. Tailoring products to fit into identified successful price tiers while actively boosting reviews could be significant strategies in accessing the substantial revenue pool that the top products capture. ## Identifying Profitable Products Using BSR Tracking the Best Seller Rank (BSR) is a pivotal element in identifying profitable products on Amazon. In the European marketplace, where competition is intense, knowing how to evaluate this data can offer a significant edge. ### Evaluating Revenue in the Top Products The top 10 products in the market capture an astonishing 63% of the total revenue, contributing €2,671,500 out of a total market revenue of €4,228,878.99. This concentration of sales among a small selection of products underscores the importance of breaking into the top seller list. The average price among these products hovers around €15.53, illustrating that price alone isn't the primary driver of success, given the price variability (standard deviation of €9.13). Instead, factors like product differentiation and market positioning become crucial. To get a picture of potential earnings, consider the average monthly sales per product sitting at 6,823 units. Products in the top tier sell even more, reinforcing the idea that once a product begins to climb the ranks, its potential for revenue can escalate quickly. If you plan a product launch, targeting a pricing strategy near these averages while ensuring superior quality could be your entry ticket to top-tier revenue.  ### Understanding Consumer Trust Understanding consumer trust through the lens of reviews and ratings is non-negotiable. With an average of 103,482 reviews per product and an excellent average rating of 4.5, the level of customer engagement is intensely high. This data point indicates that these products not only meet, but likely exceed consumer expectations, fostering repeat sales and positive word-of-mouth. Given this context, any new product entry should prioritize building a strong review base quickly to signal trustworthiness to potential buyers. Utilizing platforms to encourage reviews and ensure customer satisfaction can catapult a new entrant from obscurity to visibility more rapidly. This approach, coupled with maintaining a competitive pricing strategy, is key to establishing a foothold in such a consumer-trusted market. In this landscape, understanding where consumer trust is placed can help pinpoint which niches are ripe for entry and which segments might require more substantial investment for gaining consumer confidence. If you're exploring a new product idea, consider aligning with highly rated competitors and distinguishing yourself through differentiated features or service enhancements. ## Challenges and Considerations in BSR Analysis ### Competitive Landscape Analyzing the Best Seller Rank (BSR) on Amazon can be a double-edged sword for sellers, particularly in highly competitive markets. With an average BSR as low as 2, it indicates a very competitive landscape. Products in this market are selling fast and frequently — a great sign for demand but a daunting challenge for new entrants. Yet, the top 10 products dominate with 63% of the total market revenue, pulling in €2,671,500 out of a €4,228,878.99 market. This concentration of revenue among a few top players illustrates the barriers to breaking into the market. If you aren't prepared to compete at the highest level, your product risks being overshadowed by these heavyweights. Making significant inroads requires strategic undercutting or differentiating in ways that capture consumer interest quickly.  ### Adapting to Market Changes The dynamic nature of Amazon's ecosystem means that being agile is crucial. Price variability, for instance, is high in this market, with prices ranging from €3.90 to €42.99 and a standard deviation of €9.13. Such a wide spread in pricing strategies points to opportunities for either budget or premium positioning. Sellers who can swiftly adapt — by monitoring these trends and adjusting their strategies in real-time — stand to navigate market shifts better. Keeping an eye on review counts and ratings should also be part of this adaptability plan, given the average review count of 103,482 and an average rating of 4.5, both suggest high levels of consumer interaction and satisfaction. While there's no explicit trending data over 30 days provided here, staying prepared for a sudden shift in BSR trends is prudent. Responding quickly to market signals could mean the difference between a product becoming a forgotten listing or a best-selling contender. Understanding these nuances is key to making informed decisions when entering and competing in such a highly active market. Keeping abreast of these changes not only boosts competitiveness but sets the foundation for sustainable success. ## Conclusion: Making BSR Analysis Work for You ### Recap of Key Points Understanding the Amazon Best Seller Rank (BSR) can significantly enhance the optimization of your product's performance on the marketplace. Our analysis highlighted several key points: first, with the average price sitting at €15.53 and a significant deviation of €9.13, the EU market presents diverse pricing strategies that sellers can exploit. The low average BSR of 2 underscores a highly competitive environment where products are moving quickly. Also, a mere 10 products dominate with 63% of the total market revenue (€4,228,878.99), illustrating the importance of becoming a top seller. Moreover, the impressive average of 103,482 reviews shows robust customer interaction, a level of engagement pointing towards high consumer trust in established brands. ### Next Steps in Your Product Research To use BSR analysis effectively, focus on identifying gaps where your product can fit profitably. Start by targeting niches within categories dominated by top players, as the 6,823 average monthly sales suggest robust demand across the board. Consider pricing strategies that either compete on price points around €15.53 or break into higher tiers around the €42.99 mark. Engage with the vibrant consumer base by cultivating reviews — a vital component given the high average review count per product. Finally, analyze the overall BSR trends to ensure your upcoming launch aligns with market demands and competitive pressures. This comprehensive approach will support not just entry, but sustainability in the marketplace.  --- Understanding BSR trends is crucial for discovering profitable Amazon products. When we examined the data, one key revelation was the stark difference in BSR behavior between top and average listings. The top performers maintain a narrow BSR range, indicating consistent sales and higher visibility, while average listings fluctuate widely — evidence of inconsistent demand and missed opportunities. Another insight is the strong correlation between review velocity and BSR rank. Products with a steady influx of new reviews typically experience better sales performance, making effective review strategy pivotal. Tracking these trends can be daunting, but tools like AgentXray can automatically watch BSR changes over time, so you’re not playing catch-up with market shifts. Let the data lead you to smarter decisions and higher profits, because those who wait for intuition alone often miss the riches data reveals. --- ## About this article This article was researched and drafted with AI assistance. Before publication, it passed automated editorial review against Avanta Global EOOD's published editorial standards (factual accuracy, source attribution, voice & readability). Our [editorial standards page](/disclosure) documents exactly what we check. We continuously monitor published content for accuracy and update articles when new information emerges. Learn more about our [editorial process](/disclosure) and the team [behind AgentXray](/about). *Want to run your own analysis? [Try AgentXray](https://agentxray.ai).* ## Related reading - [best seller rank analysis](https://agentxray.ai/blog/find-profitable-amazon-products-bsr-analysis) - [this related guide](https://agentxray.ai/blog/understanding-amazon-bsr) - [AgentXray's amazon product research criteria analysis](https://agentxray.ai/blog/amazon-product-research-criteria-numbers)
About this article
This article was researched and drafted with AI assistance. Before publication, it passed automated editorial review against Avanta Global EOOD's published editorial standards (factual accuracy, source attribution, voice & readability). Our editorial standards page documents exactly what we check. We continuously monitor published content for accuracy and update articles when new information emerges. Learn more about our editorial process and the team behind AgentXray.